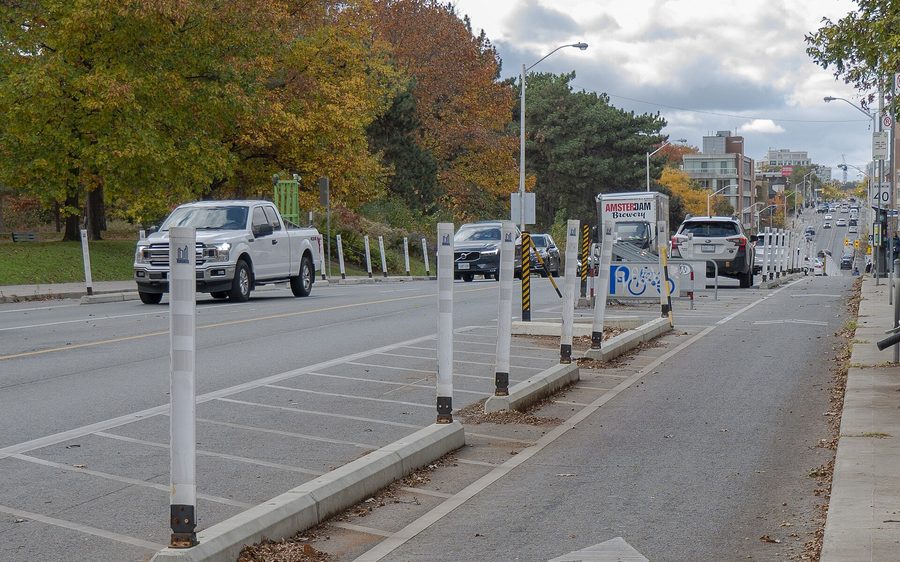
Shops, restaurants and neighbors along Boston Post Road depend on curb parking. NYSDOT studied how it's used and kept most of it, and where spaces go, it's usually for safety.
Parking
Curb parking keeps businesses open and gives neighbors somewhere to put their cars, and NYSDOT treated it that way. It studied how parking along the corridor is actually used before drawing the plan, and kept it where it's needed. Its April 2026 plans keep most of it, several blocks gain spaces, and many of the spaces that go are rarely used.
The plan also adds spaces, and makes spaces people already use legal:
13 new spaces across from the residential building by Alden Road.
6 new spaces between Beach Avenue and Manor.
34 spaces by Mamaroneck High School that drivers park in today become marked, legal spaces.
Where spaces are removed or moved, it's usually for safety:
Longer bus stops. Modern stops run about 100 feet instead of 30, so a bus can pull fully to the curb instead of stopping in a travel lane. Several stops also move across an intersection.
Clear sight lines at intersections, so drivers pulling out of side streets can see people crossing and cars coming.
Curb extensions, which shorten the distance people have to walk across the road.
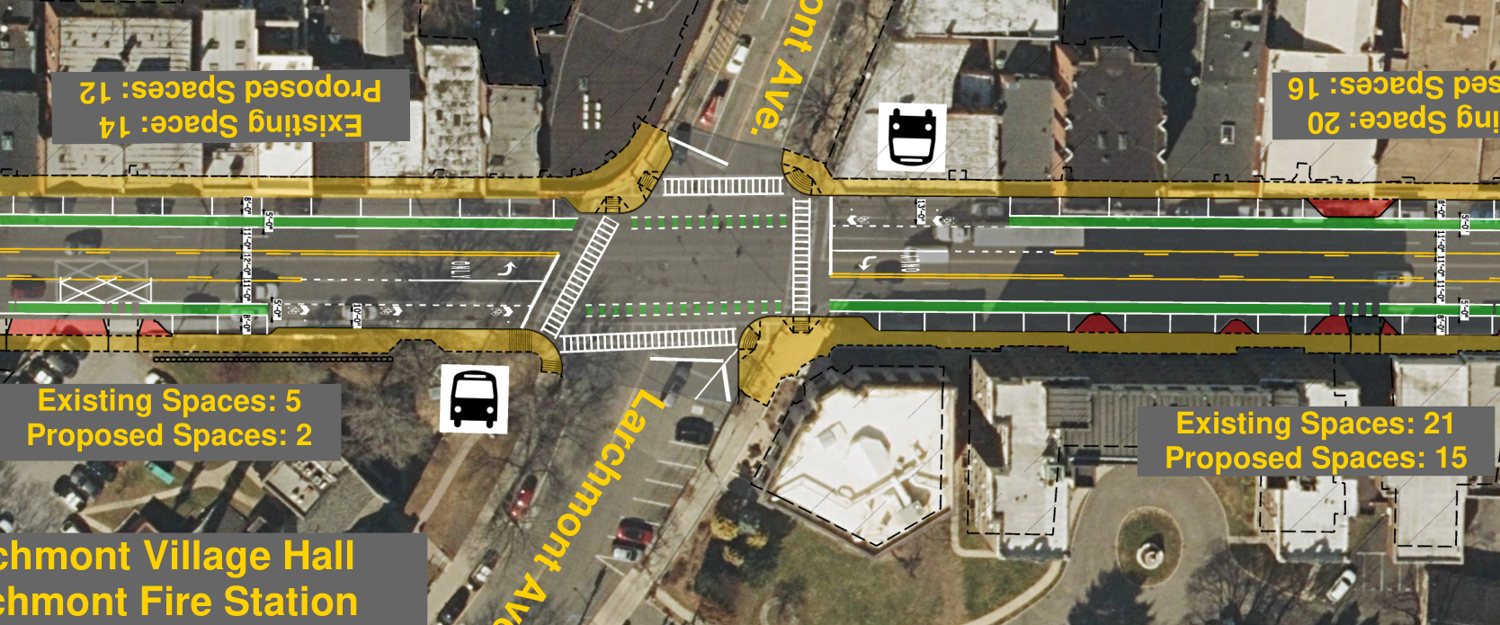
At Larchmont Avenue, a bus stop sits on each side of the street next to the intersection. Modern stops need a longer stretch of curb, which is part of why the blocks beside them lose a few spaces. The yellow labels give each block's existing and proposed spaces; the red marks are decorative buffers, where we think some spaces could be won back. From NYSDOT's April 2026 roll plots.
NYSDOT was thoughtful about where to keep and add parking
Where the street is too narrow to keep both sides, NYSDOT kept the side that needs it: the homes and businesses with no off-street parking of their own. Where that need changes sides, so does the parking.
At Lorenzen Street the kept parking crosses the road. West of it, the south side keeps 14 of its 19 spaces while the north side loses its 8. East of it, the north side keeps 14 and the south side's 6 go.The same switch between Dubois Avenue and Beach Avenue: the north side keeps 14 of 29 spaces along one stretch, and closer to Beach Avenue the south side keeps 14 of its 42.
Where we think the plan can do better
Safe Routes to School volunteers went through NYSDOT's plans block by block. We think NYSDOT did a good job balancing parking, safety and traffic flow, and we found places where it could do better. We've passed these to the villages and town, since several are best solved locally:
Downtown Larchmont. Some spaces are lost to decorative buffers and generous clearance around rarely used driveways. Working with NYSDOT, the village could win back some or most of them.
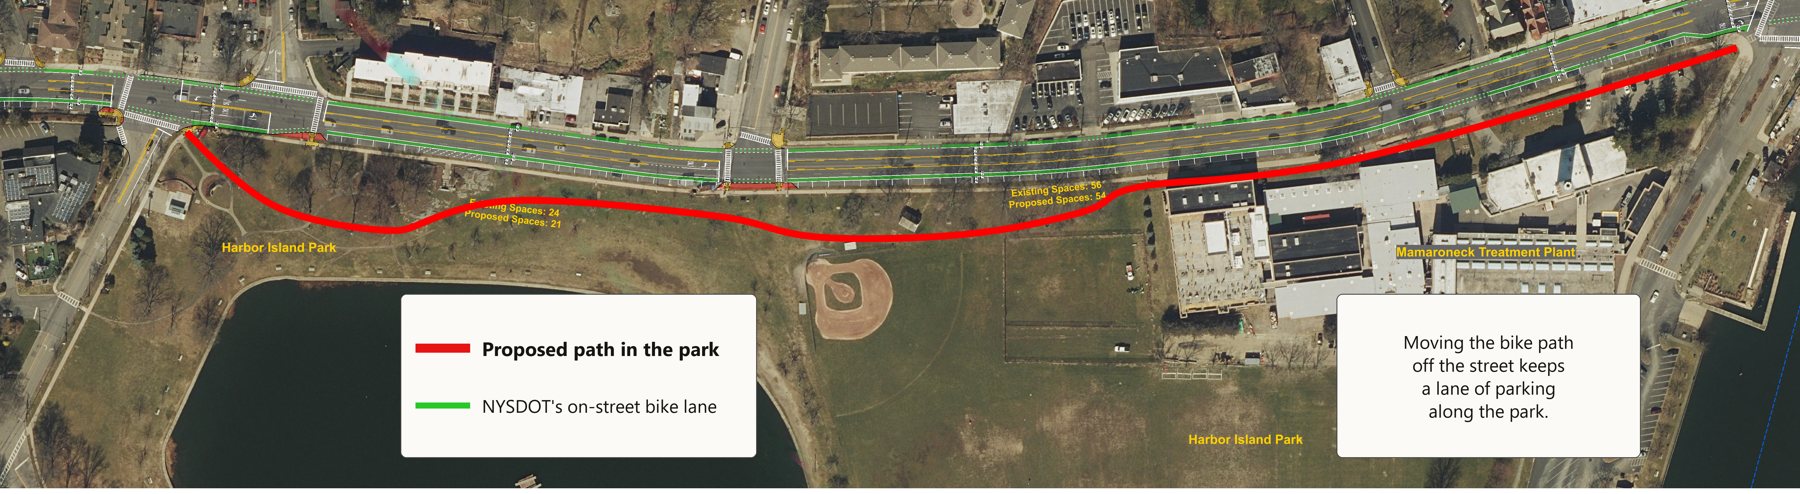
Orienta to Mamaroneck Avenue. Fitting a bike lane on the street takes out a lane of parking used by Harbor Island and the businesses across from the water treatment plant. Moving the bike path into the park would be nicer, safer, and keep that parking.
Our suggestion, drawn by Safe Routes to School on NYSDOT's plan: a bike path through Harbor Island Park (red) instead of the on-street bike lane (green) along this stretch.
Delancey and Orienta. Changing access at Delancey, perhaps with no left turns, could make the proposed roundabout unnecessary, saving money and Harbor Island Park land.
Some spaces can't come back under any design: a bus stop built to today's standards is simply longer than the one it replaces.
NYSDOT is still refining the parking layout. The latest version is in the project documents.
Studies show positive or no economic impact from bike and pedestrian improvements
Business owners ask whether fewer lanes mean fewer customers. It's a fair question, and it has been studied more than most people realize.
The big picture · Volker & Handy, UC Davis, 2021
23 studies, 45 streets, 16 cities
Researchers at UC Davis gathered every original US and Canadian study from 2000 to 2020 that measured what happened to nearby businesses after a street was changed for walking or biking, or compared what shoppers spend by how they arrive.
The 18 bike facilities checked with statistical tests
11 betterBetter for business
Portland: Stark & Oak Streets
Minneapolis: Central Avenue
Minneapolis: Franklin Avenue
Minneapolis: North Second Street
Memphis: Broad Avenue
Indianapolis: Massachusetts Avenue
Indianapolis: Virginia Avenue
Seattle: Second Avenue
Seattle: Broadway
Denver: Larimer Street
Denver: 15th Street (cycle track)
7 no significant changeNo significant change
Minneapolis: Riverside Avenue
Memphis: Madison Avenue
San Francisco: 17th Street
Denver: 15th Street (shared-lane markings)
Toronto: Bloor Street
Los Angeles: York Boulevard
San Francisco: all bike lanes and boulevards added 1996–2013
None worse. In the authors' words, “none of the studies shows a negative correlation.” Hover over or tap a bar to see the streets.
The 6 pedestrian improvements
6 betterBetter for business
San Francisco: Polk Street (trees and lighting; a travel lane removed)
Minneapolis: Lyndale Avenue South (median, curb extensions, lighting; a travel lane removed each way)
Brooklyn: Pearl Street plaza
Manhattan: Pearl Street seating area (a travel lane removed)
Manhattan: St. Nicholas and Amsterdam Avenues (intersection redesign, seating)
Brooklyn: Willoughby Plaza (travel lanes and parking removed)
Plazas, seating, trees, lighting and medians; 5 of the 6 took away a travel lane or parking. The two tested statistically, Polk and Lyndale, were both positive.
The 4 projects combining bike and pedestrian improvements
3 betterBetter for business
Brooklyn: Vanderbilt Avenue (a travel lane each way became a center turn lane, plus bike lanes)
Manhattan: Union Square North (cycle track, plaza)
The Bronx: The Hub (curb extensions, trees, bike lanes)
of the 20 streets that did better, across all the studies, had lost travel lanes or parking to make room.
5
streets had reported declines, all in studies without statistical tests: business and resident surveys in Vancouver and Chicago, and Calgary counts with no comparison street.
2 road diets
in the review, Vanderbilt Avenue in Brooklyn and Lyndale Avenue in Minneapolis, each dropped a travel lane in each direction. Both did better.
6 of 8
spending studies found people who walk or bike spend more per month than drivers, because they come more often. Two confirmed it statistically.
The caution: three studies found that businesses built around the car, such as auto parts and repair shops, gas stations and large home-goods stores, might see flat or falling sales.
The authors' conclusion: the weight of the evidence points to a positive, or at least non-negative, effect on shops and restaurants, even where travel lanes or parking are removed.
The studies closest to Boston Post Road are below.
Four-lane roads that became three
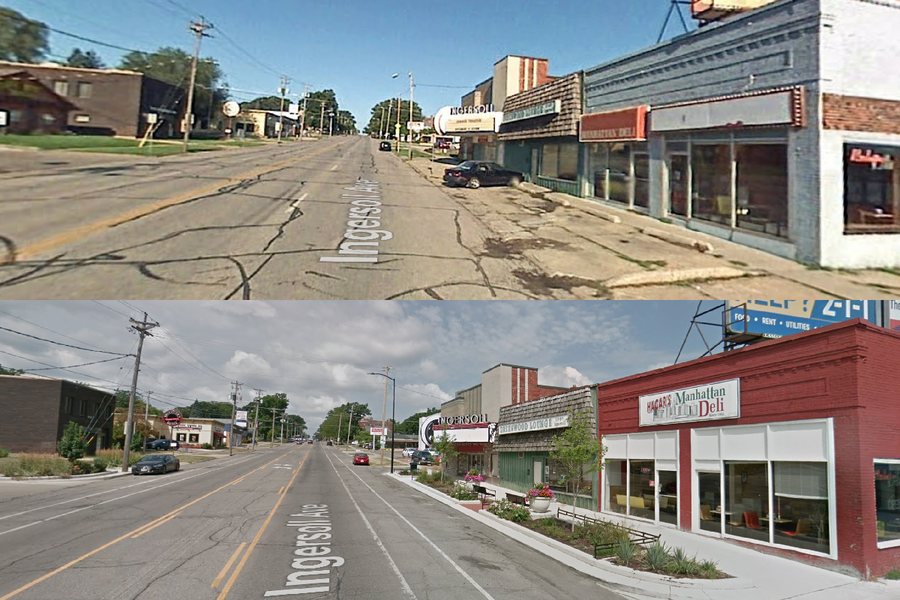
Ingersoll Avenue before (top) and after. Image: Project for Public Spaces, from Google Street View.
Ingersoll Avenue, Des Moines · 2010
Traffic held, crashes fell by half, most businesses saw no change
A two-mile road diet on a street of small, locally owned shops and restaurants carrying 11,000 to 17,000 vehicles a day, similar to Boston Post Road. Traffic volumes did not drop. Most business owners saw no effect, 23% reported more shopping, and a majority favored keeping it.
Same street, same years: the road-diet half (left) and the half that kept four lanes (right). Drag either view to look around.
York Boulevard, Los Angeles · 2006
No difference from the half of the street that kept four lanes
Half of the corridor got a road diet; the other half didn't. Property values, new business openings and business closures showed no significant difference between the halves. Parking was not removed.
Actual sales, compared with similar streets
Seattle, 7 safety projects · 2024
Sales grew the same as at 18 comparison sites
Taxable sales near the projects rose $1.20 million a year, against $1.14 million at matched sites with no changes. The difference is not statistically significant. The authors conclude these projects are not linked to harm for nearby businesses.
14 streets in 6 cities · 2020
Retail did better on 9 of 14 improved streets
Portland State compared improved streets with similar ones that weren't changed. Retail was better on 9, unchanged on 2 and mixed on 3. A 2008 road diet on Lyndale Avenue in Minneapolis saw retail sales rise.
9th Avenue at 30th Street. Photo: Jim Henderson (CC0).
9th Avenue, Manhattan · 2013
Local retail sales up 49% in three years
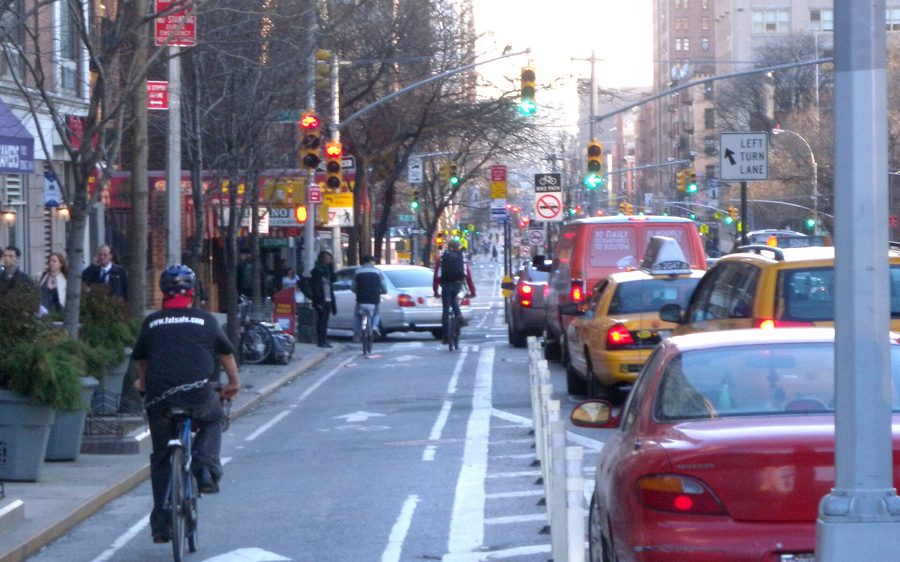
One of four travel lanes became a protected bike lane and turn lanes, and the parking stayed. Sales at local ground-floor shops rose 49%, against 3% across Manhattan.
Bloor Street. Photo: Dillan Payne, CC BY-SA 2.0, cropped.
Bloor Street, Toronto · 2017
Merchants overestimated how many customers drive
Measured before and after a bike lane, against a similar street without one: visitors came more often and vacancies held steady. Most merchants believed at least a quarter of their customers drove; fewer than one in ten did.
What it means here
The review's caution about car-oriented businesses matters here: Boston Post Road has gas stations and repair shops, and their concerns about driveway access deserve direct answers from NYSDOT.
The practical lessons: keep parking and loading where businesses need it, which is the aim of the improvements we've passed along, and measure sales and parking before construction so the result can be checked afterward.
Sources
NYSDOT, Westchester County US Route 1 Complete Streets
Mamaroneck and Rye Neck Safe Routes to School, review of NYSDOT's proposal, June 2026
Presented at the spring SRTS meeting and shared with the Village of Larchmont, Village of Mamaroneck and Town of Mamaroneck.
Volker & Handy, “Economic impacts on local businesses of investments in bicycle and pedestrian infrastructure: a review of the evidence,” Transport Reviews, 2021
23 studies, 2000–2020: 8 on spending by travel mode, 15 on 45 specific facilities in 16 US and Canadian cities. Transport Reviews 41(4), 401–431. Open access.
McCormick, “York Boulevard: The Economics of a Road Diet,” UCLA, 2012
Road diet (2006) and bike lanes (2010) on one half of the corridor, the other half unchanged; property sales, business openings and closures, sales tax and surveys.
Liu & Shi, “Understanding Economic and Business Impacts of Street Improvements for Bicycle and Pedestrian Mobility,” Portland State University / NITC, 2020
14 improved corridors in 6 cities, each with a control corridor; employment and sales-tax data.
Toronto Centre for Active Transportation, “Economic Impact Study of Bike Lanes in Toronto's Bloor Annex and Korea Town,” 2017
3,005 visitor and 525 merchant surveys, before and after, with Danforth Avenue as the control. Peer-reviewed as Arancibia et al., Journal of the American Planning Association, 2019.