A road diet isn't an experiment. State transportation departments have built them on busy main streets for decades, including on state highways that carry more traffic than Boston Post Road.
Broad Street in Woodbury is a state highway through a county seat: a historic downtown, strip centers and blocks of homes, much like Boston Post Road through Larchmont and Mamaroneck. In 2012 NJDOT converted 0.8 miles of it, from Carpenter Street to Red Bank Avenue, from four lanes to one lane each way with a center turn lane and bike lanes, keeping parking where it could.
18,449vehicles a day on Route 45 in Woodbury, 2012
14,958on Boston Post Road in Mamaroneck, 2024; 10,104 in Larchmont
NJDOT made the change to address pedestrian safety and congestion at intersections with no room for left turns. Woodbury's police opposed it at first, worried about response times. After it was built, the retired police chief said it did not affect them.
Nearby examples
Brian Dempsey, who chairs Rye’s Traffic and Pedestrian Safety Committee, tells the story to former Mayor Doug French.
Boston Post Road (US 1), Rye, New York
“The diet has been a huge success”
Boston Post Road already has a road diet in Rye. It's not a perfect comparison because it's primarily residential, but it shows two things:
There were concerns before it was built. When Rye proposed it, Mamaroneck warned it would back traffic up for three miles. Brian Dempsey, who chairs Rye's Traffic and Pedestrian Safety Committee, tells that story in the interview above.
Then it worked. Rye's road had our problem: four lanes about nine feet wide, against the 11-foot standard. Comparing the crashes counted in the city's own 2007 study with NYSDOT's records for the years after the change: total crashes down 67%, and at the Osborn Road intersection by Osborn Elementary School, down more than 90%.
Eighteen years on, the three-lane road is simply how Boston Post Road works in Rye. Doug French, Rye’s former mayor, sums it up in the interview: the diet “has been a huge success.”
Watch the meeting on YouTube. The owner doesn't allow it to play here.
US Route 1, Fairfield, Connecticut · 2025
The same road, explained in public
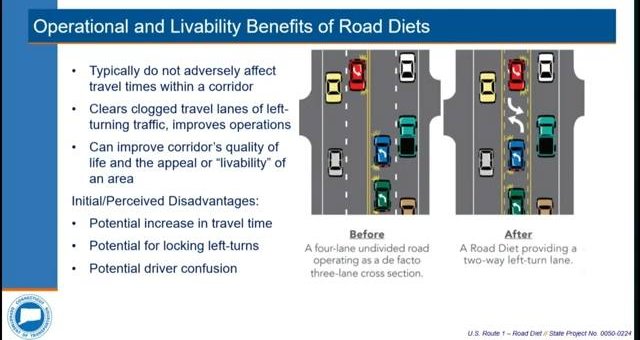
Connecticut restriped its own Boston Post Road, Route 1 from Pease Avenue to Beaumont Street, from four lanes to three with a center turn lane in 2025, with resurfacing, signal upgrades and curb ramps. It carries about 14,500 vehicles a day, close to the Post Road in Mamaroneck.
What stands out is how CTDOT explained it. Its project team held a public meeting in Fairfield, in person and streamed on Webex, YouTube and local TV, and walked through why the road needed a change, what a road diet is, what it would do to traffic and the crash record behind it, then took questions. It posted the recording and project materials online and gave residents two weeks to send comments, inviting them “to share their feedback with the CTDOT project team to incorporate into the design.”
That kind of walk-through helps a community weigh a change like this, and it's worth asking for here. Jump to the parts you want:
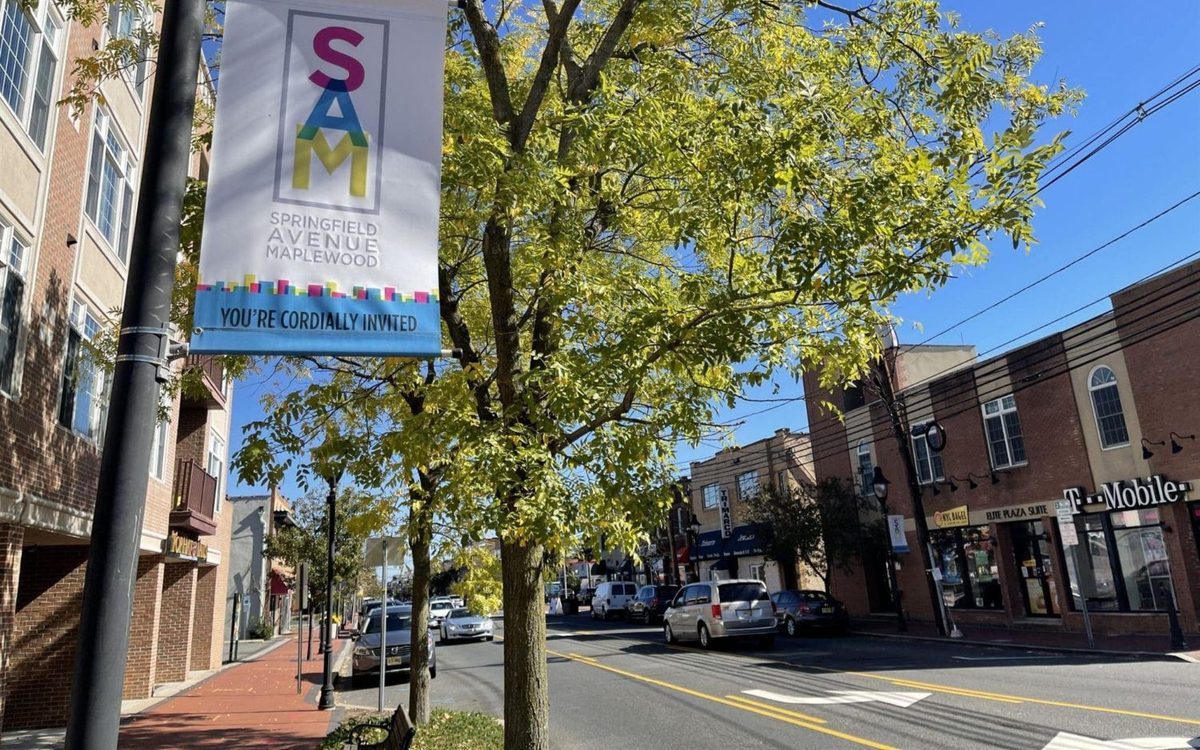
Springfield Avenue (NJ 124), Maplewood, New Jersey · 1997
Turning a highway back into a “handsome and walkable boulevard”
Springfield Avenue was the through road west from Newark until Route 24 and Interstate 78 took the long-distance traffic, the same thing I-95 did to the Post Road. What was left was a four-lane state highway running through Maplewood's largest business district, which the township came to see as a barrier between its neighborhoods.
The push came from the Economic Development Commission rather than from traffic engineers. In 1997 it set out to revive the Springfield Avenue shopping district, with the stated goals of raising property values on the avenue and in the surrounding neighborhoods, increasing retail spending in the town, and improving the town's image. Narrowing the street was part of that strategy, and NJDOT restriped the four lanes to one each way with a center left-turn lane. The streetscape work was meant, in the plan’s words, to slow the fast-moving traffic.
Today Springfield Avenue carries 16,960 vehicles a day, more than the Post Road carries here.
US Route 9, Town of Ossining and Briarcliff Manor · 2007
A state highway past strip commercial
South of the Village of Ossining, Route 9 runs past strip shopping and a string of side streets and driveways with no traffic signals. It was converted from four lanes to one lane each way with a center turn lane in 2007, when it carried 15,308 vehicles a day, about what the Post Road carries in Mamaroneck today. No bike lanes were added.
In 2021 a study for the Village of Ossining found that extending the road diet north through the village was feasible.
Commerce Drive, Fairfield, Connecticut
Strip commercial, at Rye Neck's traffic
A strip of shopping centers and restaurants carrying about 10,500 vehicles a day, close to Boston Post Road between Rye Neck and the Rye border (9,740 in 2025). It was converted to one lane each way with a center turn lane.
Livingston Avenue, New Brunswick, New Jersey · 2020
Homes and shops, at more traffic than ours
Livingston Avenue is a close match to our stretch of Boston Post Road: a county road through a mix of houses and strip commercial, running into downtown New Brunswick. It carries 16,942 vehicles a day, more than the Post Road carries in Mamaroneck, about 15,000, or in Larchmont, about 10,000.
Before changing it, the city had Rutgers' Voorhees Transportation Center study the idea. The researchers modeled the traffic and found the added delay would be small, with no drop to an unacceptable level of service, and estimated about 19% fewer crashes. The safety benefits outweighed the extra travel time.
The city and Middlesex County converted it in 2020 to one lane each way with a center turn lane, bike lanes and pedestrian improvements.
North Main Street, West Hartford, Connecticut · 2021–22
Winning over a skeptical town with a trial
A 1.5-mile residential arterial carrying 12,000 to 17,000 vehicles a day. The idea took seven years: a regional study in 2015, a trial budgeted in 2019, and a trial striped in August 2021, one lane each way with a center turn lane. Instead of arguing about the worries, the town measured each one during the trial.
Cut-through traffic. Neighbors north of Fern Street feared drivers would race through side streets. Counts showed they didn't.
Crashes. 16 on North Main Street in the seven trial months, against 18 to 51 in the same months of each of the four years before.
Emergency response. Police, fire and ambulance raised no life-safety concerns and supported the change.
The public. Of 1,914 people surveyed, two-thirds wanted it made permanent. Complaints centered on signal timing and drivers learning the center lane, and the town adjusted both.
The town made it permanent in June 2022.
Bigger studies
Virginia · Virginia Transportation Research Council, 2020 and 2022
One state's road diets, reviewed and then measured
The 2020 review
Virginia's DOT asked its research council to take stock of every road diet built in the state since 2010. It found 66 projects covering about 39 miles and asked the cities and counties that built them how they turned out.
Did the road diet meet its goals? Local officials on 25 projects:
18 met their goals
3 mixed results
3 too new to judge
1 unknown
None drew mostly negative feedback from the public; of the 18 that drew any, half was mostly positive and half mixed.
No general congestion problems, the localities reported.
No practically significant change in average speeds on the Fairfax County road diets the researchers measured.
Researchers at the same council then compared crashes before and after at 36 stretches of road and 39 intersections where Virginia turned four lanes into three between 2009 and 2018. They used the empirical Bayes method, which corrects for changes in traffic and for sites picked right after a bad year. Every result was statistically significant.
−64%
crashes that killed or injured someone, along the converted stretches. Total crashes fell 38%.
−46%
injury and fatal crashes at intersections on the converted roads. Total crashes there fell 35%.
2,600–17,000
vehicles a day on the roads studied. Boston Post Road carries 10,000 to 15,000.
And Virginia kept building them
We count at least 10 more completed since 2019, from Seminary Road in Alexandria and Wilson Boulevard in Arlington to VDOT's own four-to-three conversions of Route 360 on the Northern Neck. Since 2019 Virginia's highway safety program has also paid for road diets on local roads as a proven, low-cost safety fix, often restriped during repaving, the way NYSDOT plans to do it here. That count is a floor: it includes only projects we could confirm were finished.
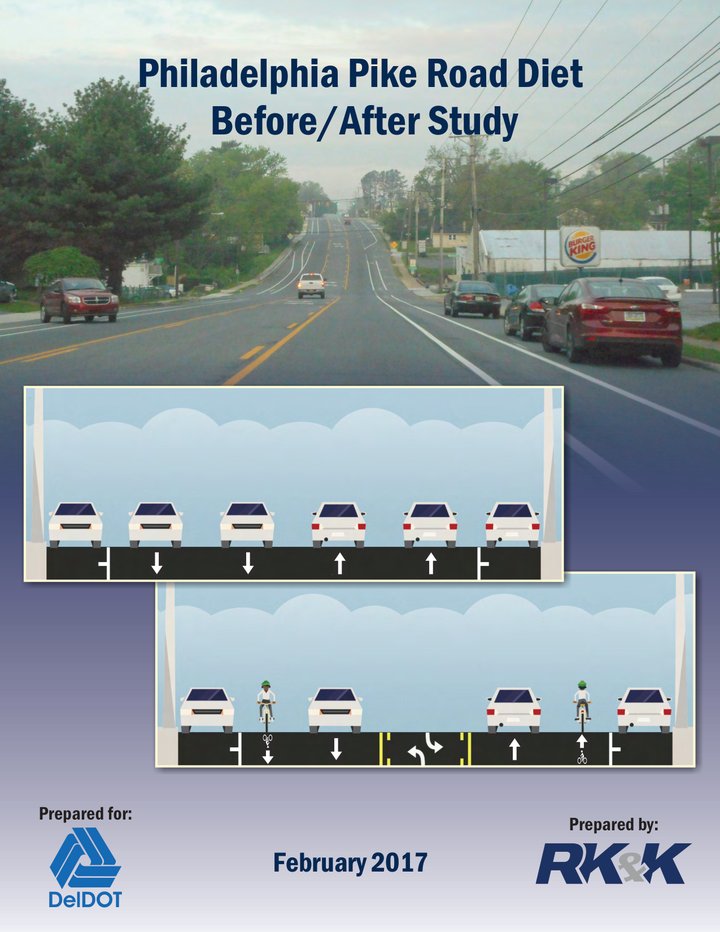
Delaware's DOT publishes before-and-after studies of its road diets. Three of them look like Boston Post Road: four lanes turned into one lane each way with a center turn lane, on busy arterials.
volume on Philadelphia Pike in Claymont in the years after its road diet, while the parallel road, Governor Printz Boulevard, lost 36%. Drivers moved onto the road diet, not off it, though the report says regional shifts may play a part.
−13%
total crashes on Philadelphia Pike, three years before against three after. Angle crashes fell 26%.
16 → 5
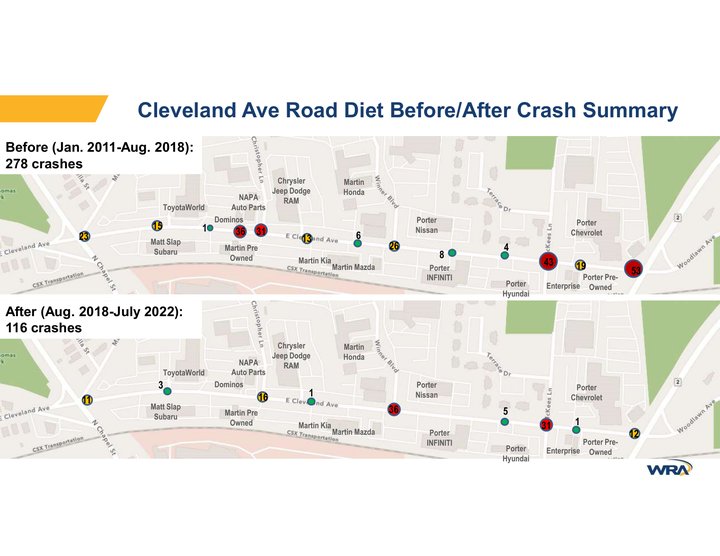
angle crashes a year on Cleveland Avenue. On Maryland Avenue in Wilmington, 28 a year fell to 15 in the first year.
Sources
NJDOT, Route 45 Complete Streets project in Woodbury, press release, May 15, 2012
0.8 miles, Carpenter Street to Red Bank Avenue; one travel lane each way, a center left-turn lane and a bike lane; $1.4 million.
“Post Road Safety Improvements (Road Diet Proposal),” public meeting with CTDOT, April 25, 2024; recording by FairTV Government, Town of FairfieldYouTube
Ohlms, Dougald and MacKnight, “How's That Diet Working: Performance of Virginia Road Diets,” Virginia Transportation Research Council, VTRC 20-R19, April 2020
Inventory of 66 road diets built since 2010; local survey results on pages 33–35.
DelDOT, Road Diet / Roadway Reconfiguration: locations and before-and-after studiesdeldot.gov
RK&K for DelDOT, “Philadelphia Pike Road Diet Before/After Study,” February 2017
About a mile, Rolling Road to Governor Printz Boulevard, built 2012. AADT 14,490 (2008) to 15,918 (2016); Governor Printz Boulevard 6,600 to 4,200, which the report says may also reflect regional shifts. Crashes Oct 2005–Sep 2008 vs Oct 2012–Sep 2015: 160 to 139; angle 70 to 52; pedestrian/bike 1 to 6.
Jan 2011–Aug 2018 vs Aug 2018–Jul 2022: about 36 crashes a year to 29, with many after-period crashes during nearby construction; angle crashes about 16 a year to 5.
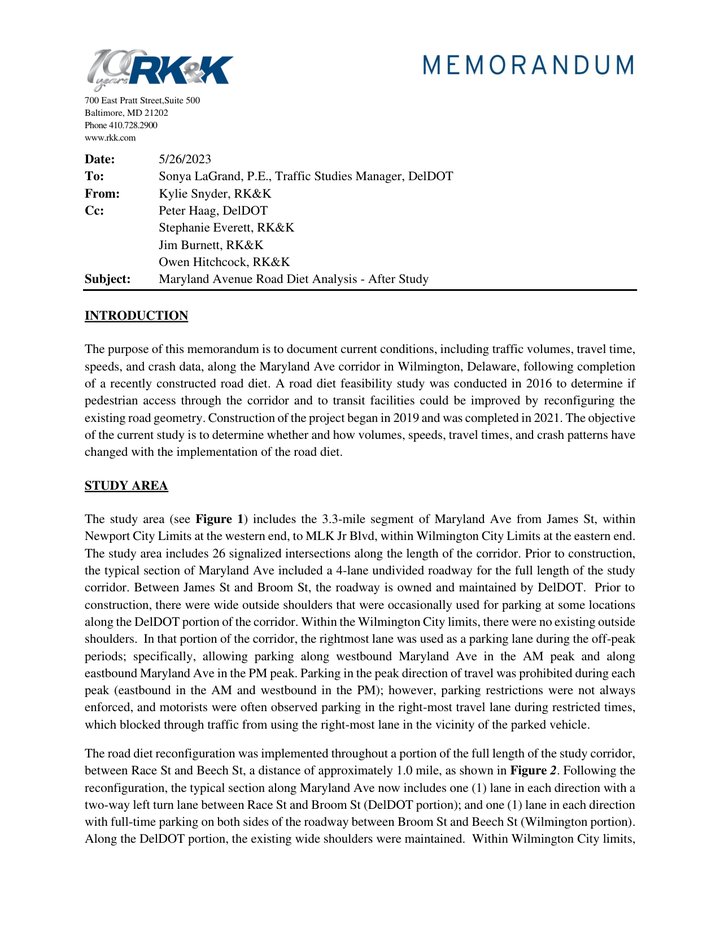
RK&K for DelDOT, “Maryland Avenue Road Diet Analysis – After Study,” May 26, 2023
Built 2019–2021. Road-diet section ADT 19,500 (2015) and 19,300 (2021). Crashes 2016–2018 average vs 2022: about 107 to 94; angle 28 to 15; sideswipe 17 to 23.
Lim and Fontaine, “Development of Road Diet Segment and Intersection Crash Modification Factors,” Transportation Research Record, 2022
Virginia Transportation Research Council. Empirical Bayes before-after study of 4-to-3 road diets installed 2009–2018. Crash modification factors: segments 0.62 total, 0.36 fatal and injury; intersections 0.65 total, 0.54 fatal and injury; significant at 95% confidence.
City of Rye Planning Department, “Frequently Asked Questions: Boston Post Road Lane Re-Striping (i.e. Diet) Project,” June 2008
Nine-foot lanes on about 36 feet of pavement against a 48-foot standard; about 7,000 vehicles a day and 500 in the peak hour; the phasing, including the deferred middle segment between Old Post Road and Eldredge Court over Oakland Beach Avenue and Osborn School queuing.
Rye crash comparison, compiled by Mamaroneck and Rye Neck Safe Routes to School
Before: the crash counts by location in Buckhurst Fish & Jacquemart's Boston Post Road Design Feasibility Study for the City of Rye, July 2007, covering 2004–06. After: NYSDOT crash records for Boston Post Road in Rye, 2012–14. Corridor-wide, 86 crashes fell to 28; at the Osborn Road intersection, 24 fell to 1. Hit-and-run crashes are excluded from both. The two periods are counted by different parties, so the comparison is indicative rather than exact.
MyRye, “Traffic & Pedestrian Safety in Rye with Brian Dempsey,” MyRye.com Conversations with Doug French, August 2026
Ewing and King, “Flexible Design of New Jersey's Main Streets,” Alan M. Voorhees Transportation Center, Rutgers, for NJDOT, 2002
Case study 3.2.1, Maplewood, pages 51–57: Route 124 superseded as a long-distance route by Route 24 and I-78; the Economic Development Commission's 1997 strategy and its goals; the “handsome and walkable ‘boulevard’” aim on page 52; the restriping to one lane each way with a center left-turn lane and parking on both curbs; NJDOT's cone-and-marking trial. The township's analysis of the next phase expected intersection level of service to improve from B–F to B–D with signals retimed to 90-second cycles, while end-to-end service along the avenue slipped from C to C–D.
NJDOT Traffic Data Management System, Springfield Avenue, Maplewood, 2025 count
Two-way average daily traffic, 16,960. The viewer asks you to accept its terms before it shows the count, so we have not read it ourselves; the figure was provided to us.
NJDOT Traffic Data Management System, Livingston Avenue, New Brunswick, 2025 count
Two-way average daily traffic, 16,942. The viewer asks you to accept its terms before it shows the count, so we have not read it ourselves; the figure was provided to us.
VHB for the Town of West Hartford, “North Main Street Road Diet Study, Phase 2, Final Report,” June 2022
Trial from August 2021. Crashes Sept–March, 2017–18 through 2021–22: 18, 24, 34, 51, then 16 during the trial. Evening-peak volumes: North Main Street −22%, Trout Brook Drive +16%. Neighborhood cut-through “did not materialize.”
We-Ha, “West Hartford Plans North Main Street Road Diet Trial to Begin Following Bridge Construction,” January 2019; “North Main Street Road Diet Trial in West Hartford to Begin the Week of August 9,” 20212019 · 2021
We-Ha, “Majority of Survey Responses Support Road Diet on North Main Street”